Hillsborough County Benchmarks (HCBM)
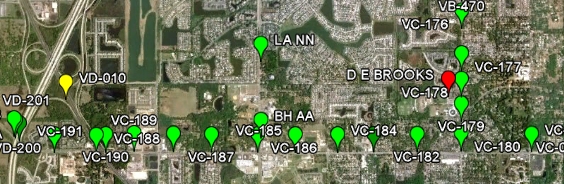
The principal component of HCBM is a Google Earth KML document that plots the approximate location of Hillsborough County benchmarks (Fig. 1) from the LABINS database. All station balloons have links to the corresponding LABINS datasheet, and stations with an NGS PID also have links to the NGS database. Station balloons contain corrective remarks for stations with errors or omissions in the LABINS database.
Marks are collected in three folders that are categorized by status and elevation from LABINS datasheets:
- Poor (red) = Destroyed, Could Not Find, or no elevation
- Fair (yellow) = NGVD 29 elevation only
- Good (green) = Both NGVD 29 and NAVD 88 elevations
HCBM also includes multiresolution images of the original Hillsborough County benchmark maps (Fig. 2), network links that plot COT (Fig. 3) and NGS (Fig. 4) benchmarks, and hyperlinks to benchmark-related, online resources.
County Benchmark Maps
Original PDF benchmark maps were converted to 300-dpi JPEG files, georeferenced using the County PLSS shapefile, and then converted into 352 tiles that are delivered by the HCBM server via region-based network links (super-overlay).
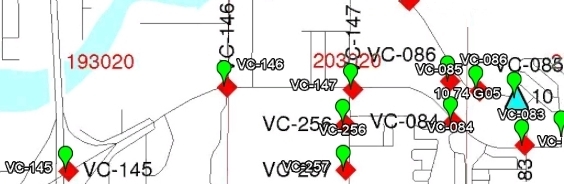
Seams are located on the W line of Range 20 E and the N line of Township 30 S,
all four original maps having a common point at the NW corner of Section 6,
Township 30 S, Range 20 E.
City of Tampa (COT) Benchmarks
The COT Benchmarks network link plots the approximate location of COT benchmarks. Content is adapted from COT Primary Benchmarks prepared by the City of Tampa Survey Section on 02/23/16.
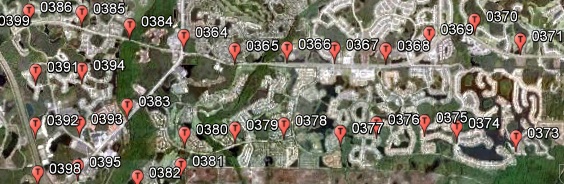
Station balloons contain all information supplied by the source document. Copy and paste balloon contents into a Microsoft Word document for subsequent printing.
NGS Benchmarks
The NGS Benchmarks network link is an implementation of NGSCS that plots the approximate location of NGS benchmarks within four miles of the view center. Station balloons contain all information supplied by the NGS station list server and a hyperlink to the full NGS datasheet.- Position the point of interest (POI) in the center of the view. One way to do this is to double-click an unmarked location. To precisely position the POI in the center of the view, add a placemark at the desired location; then edit the properties of that placemark and reset the view (explain). For best results, disable automatic tilting (Tools, Options, Navigation, Do not automatically tilt while zooming) and minimize elevation exaggeration (Tools, Options, 3D View, Elevation Exaggeration, 0.01).
-
Check the box beside the NGS Benchmarks network link.
Range rings and station markers should appear within two minutes.
- V (blue) = Vertical only
- B (pink) = Both horizontal and vertical
- On subsequent uses, reposition the POI and ensure that the network link is checked and selected. Then choose Refresh from the Edit menu, or right-click and select Refresh in the context menu (explain).
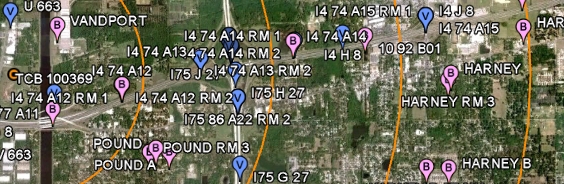
NGS benchmarks are plotted at full-precision datasheet coordinates. Benchmarks that are also horizontal control stations typically have precise geodetic coordinates with five decimal digits of seconds, while vertical-only marks are usually scaled to whole seconds.
See NGS Station List for source data. All data are retrieved from remote servers. Data errors, accuracy, and availability are beyond the control of this application.